See Everything at a Glance.
Total uploads. Success rates. Platform breakdowns. Connection health. One screen shows you the full state of your conversion pipeline — without clicking into individual relays or scrolling through logs.
Available on: All tiers
The Numbers That Matter
Six metric groups that give you instant understanding of your conversion pipeline's health.
The Dashboard
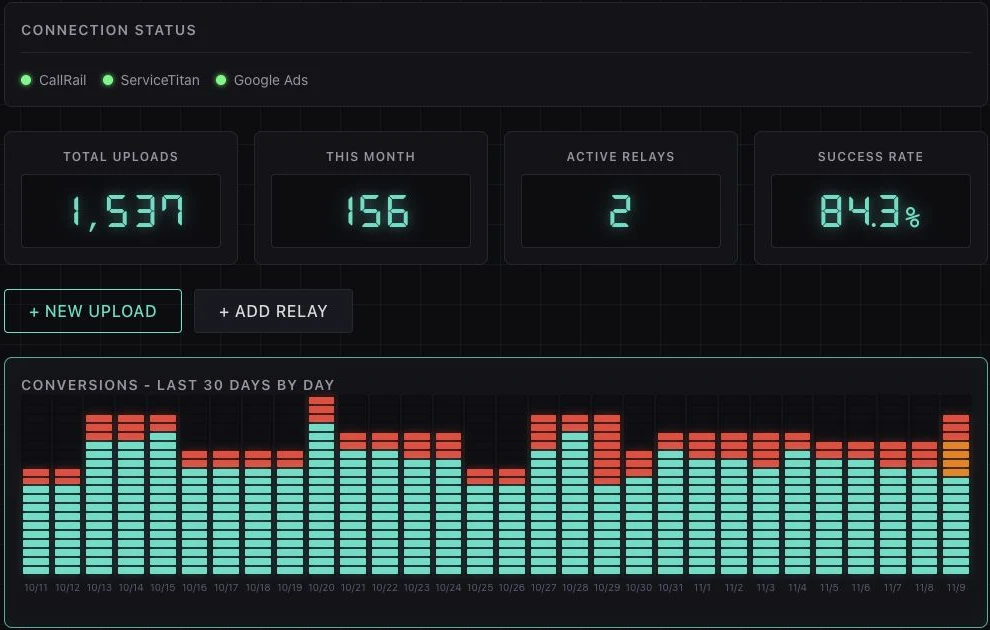
See connection health, upload totals, and daily conversion trends. This focused view uses illustrative demo data.
Recent Activity at Your Fingertips
The dashboard includes a live activity feed showing the latest relay executions, connection events, and system alerts — no need to navigate to the full Activity Logs.
Live Connection Health
Every connected account shows its current status — active, token expiring, or needs attention.
Data Sources
Destinations
Dashboard Questions
The dashboard displays: total conversions uploaded (all-time and monthly), active relay count, overall success rate, a 30-day conversion volume chart, uploads by platform (Google Ads, Meta, Microsoft, TikTok), a recent activity feed, and live connection health for all connected accounts.
Yes — the dashboard reflects current data on every page load. When a relay completes, the metrics update immediately. Connection health indicators poll at regular intervals to surface issues like expired OAuth tokens or connectivity problems as they happen.
Yes — invite clients as Viewer-role users and they'll see their own dashboard with metrics scoped to their data. Agencies on the Agency tier get the cross-client dashboard view, while individual clients only see their own conversion data. This is a powerful transparency tool for client reporting.
Yes — the standard dashboard shows metrics for a single client context (conversion totals, relay health, platform breakdown). The Agency Dashboard (Agency tier only) adds a cross-client overview — aggregated metrics across all clients, bulk onboarding, team templates, and one-click client switching.
Activity logs and relay execution data can be exported to CSV for external reporting. The dashboard itself provides at-a-glance monitoring, while the Activity Logs page offers the detailed per-record data suitable for export and analysis.